How to Perform A Site Survey
To perform an informative site survey, it is not enough to just get vibration measurement equipment and start taking measurements. You must take care to control variables and analyze data carefully. Below are some tips for conducting a successful site survey.

 Choosing the Right Sensor
- Ensure that you are considering sensors which offer the appropriate level of sensitivity. Are you trying to measure vibrations which are on the scale of g’s or micro g’s? If you are unsure of the level of sensitivity you need, consult with the sensor manufacturer to get their advice.
- No sensor can provide highly accurate data across the entire frequency spectrum. The sensor you use will need
to be designed to sense in the frequency area that is of interest. If you are interested in seismic vibration levels,
you will need a sensor that can sense below 1 Hz, it doesn’t need to go above 100 Hz. - You will need to make sure your sensor is compatible with the data processing configuration you will be using it with. For example, is the sensor ICP-powered or does it require an external power source? Herzan’s WaveCatcher can operate with both types, but many testing set-ups can not. Make sure that the output cable can connect with your data processing module.
Setting Up the Test
- Be scientific! Define what variables are to be tested and define the parameters of the test prior to beginning the test. Decide what areas will be tested and what data points you are looking for.
- Ensure that you are not changing parameters between tests which you plan to compare.
- For vibration testing, make sure the sensor is firmly coupled to the surface you would like to measure. For light accelerometer heads, adhesive or wax may be required to ensure a firm coupling.
- Narrow the frequency span of your test to achieve better frequency resolution. If you are unsure of the frequency area of interest, start with a broad frequency range and narrow your focus based on results.
Running the Test
- The more averages that are taken, the more noise will be filtered out. Taking more averages will ensure more accurate data.
- Noise levels change throughout the day, due to foot and street traffic, equipment running, and other causes. It is recommended to run tests at different times of day to filter out the periodic noise.
- Eliminate as many variables as possible when doing comparative measurements. If possible, take the data simultaneously using identical sensors, with the sensors aligned.
- Take good notes. Make note of which area you are testing, what time it is, and what machinery is in operation at the time. Make sure you correlate this information with each data set, so that you don’t have to do guesswork during the analysis stage.
Analyzing the Data
- Beware of 60 Hz spikes in the data. These are often related to electro-magnetic interference (EMI) and can be an artifact. If you notice significant 60 Hz spikes in your data, make sure your testing set-up is grounded properly and run the test again.
- Significant resonances in one axis can often feed into other axes and appear in the data for other directions. Measure multiple points in different locations to diagnose the phenomenon.
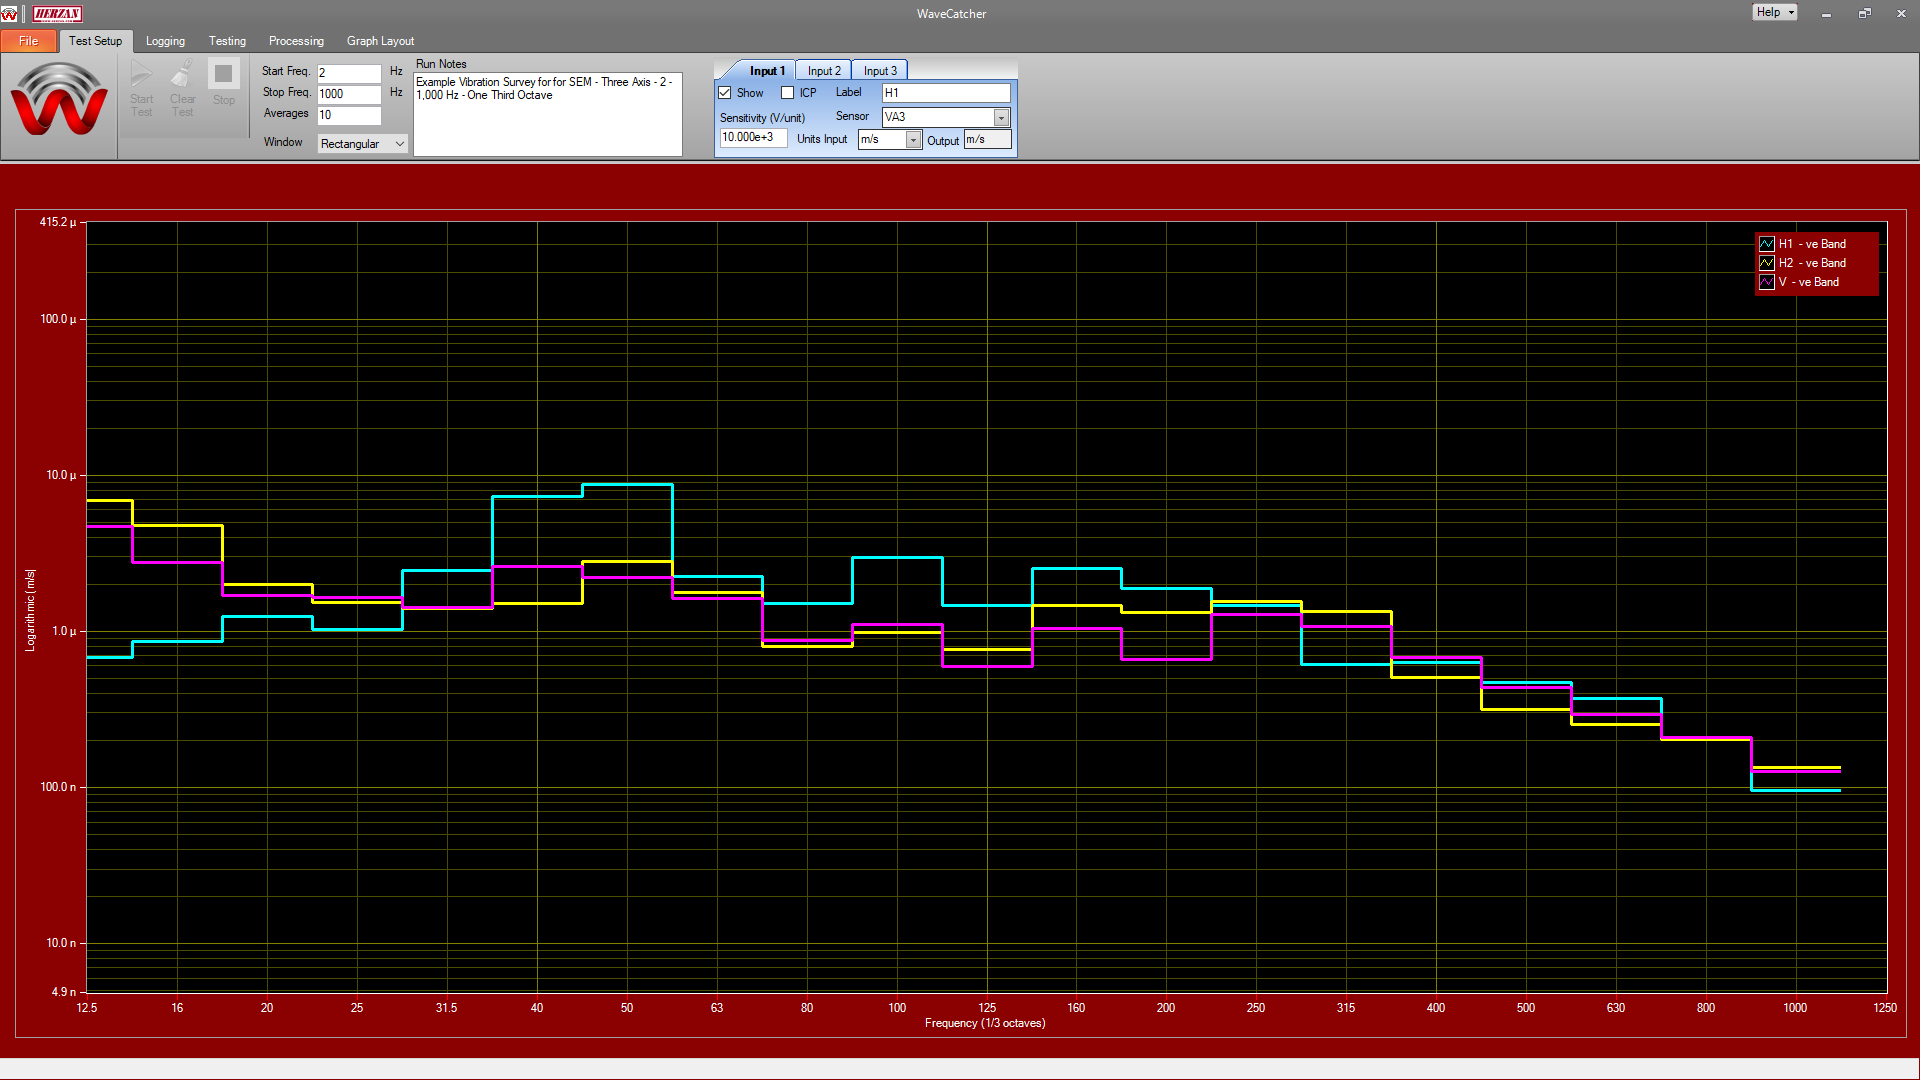
- Plot the data in a graph. It is easier to identify trends using a graphical representation than just looking at a data set.
